
By Dr. Salman Ghouri and Dr. Yumna Ghouri, 27 November 2015
Fossil fuels have been the dominant source of energy for global economic prosperity for over 150 years and today still accounts for over 86% in global energy mix. The question is what would be its role during the next 2 to 4 decades? There is an on-going debate among various agencies, researchers and academia whether the role of fossil fuels will significantly diminish. It is quite possible that things might change drastically during the next two to three decades owing to technology, severe climate change and transformation of our mind-set. In today’s world the speed of technological innovation is measured in seconds compared to decades in the past (comparatively terms). The innovation in fuel cells, electric cars, NGVs and significant decline in cost of solar and wind power during the last decade turn out to be great challenges for the oil and gas industry. The question is how big a share of fossil fuels will be taken up by renewable sources by 2040? Is this share substantial enough to undermine the role of oil and gas industry?
In order to explore the possible answer this paper forecasts the total primary energy consumption in North America by 2040 (such forecast can be carried out for other regions at a later stage). In order to estimate consumption behaviour we have to develop econometric models for oil, natural gas, coal, nuclear, hydro and renewable energy using respective prices, GDP, population, trend variable with and without constant in order to find the best estimated relationship for each of the energy resources. Different models are required to explain the behaviour of each of the energy resources as one model cannot explain the consumption pattern for all forms of energy resources, because of the importance in consumer’s budget and its usage. The consumers are generally constrained by habit, technological and other factors, such as a regulatory barriers; therefore response to a price change, or change in technology e.g. availability of electric cars, NGVs (Natural Gas Vehicles), fuel cells, is weak in the short-term. However it will strengthen over time. To capture this lag structure we have used a polynomial distributed lag model (Almon model) to estimate the respective energy demand. We have also run autoregressive and moving average wherever necessary in order to correct the autocorrelation problem. The best-fitted model has been used to forecast respective energy demand by 2040 under alternative scenarios.
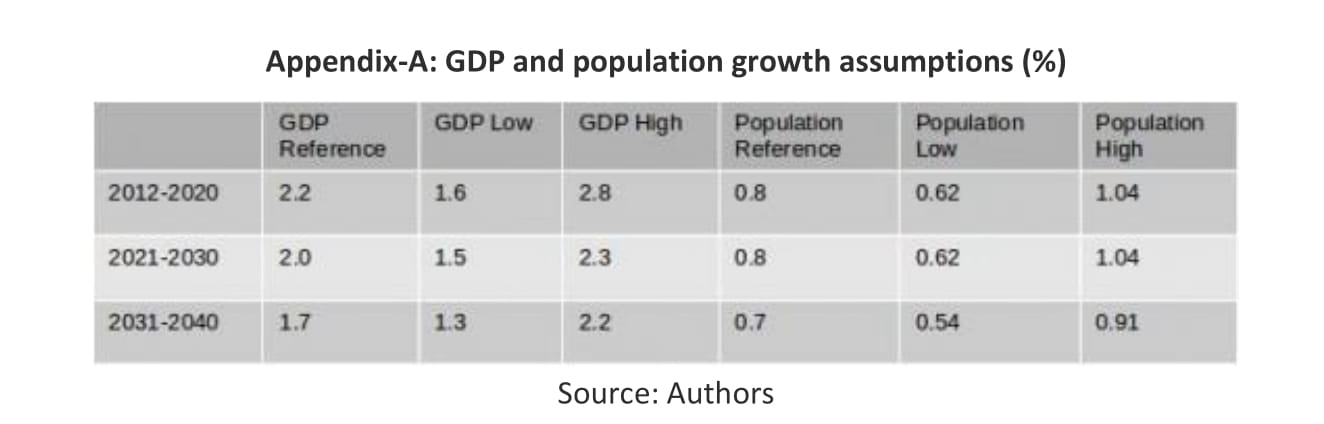
Historical data have been drawn from various sources. For instance, regional historical energy consumption is drawn from BP Statistical Review of World Energy June 2015. GDP (current prices) and population data is extracted from IMF reports and energy prices from the Energy Information Administration (EIA) reports. In order to forecast energy demand we used the GDP and population growth assumptions (shown in Appendix -A). Future forecast of energy prices – oil, natural gas, coal and electricity (though electricity prices vary from consumer to consumer; residential, industrial, commercial, transport, we have used total electricity prices) are derived from the EIA. For low and high case scenarios we have assumed GDP and population will grow at an annualized rate as highlighted in Appendix-A.
North America TPEC – 2014
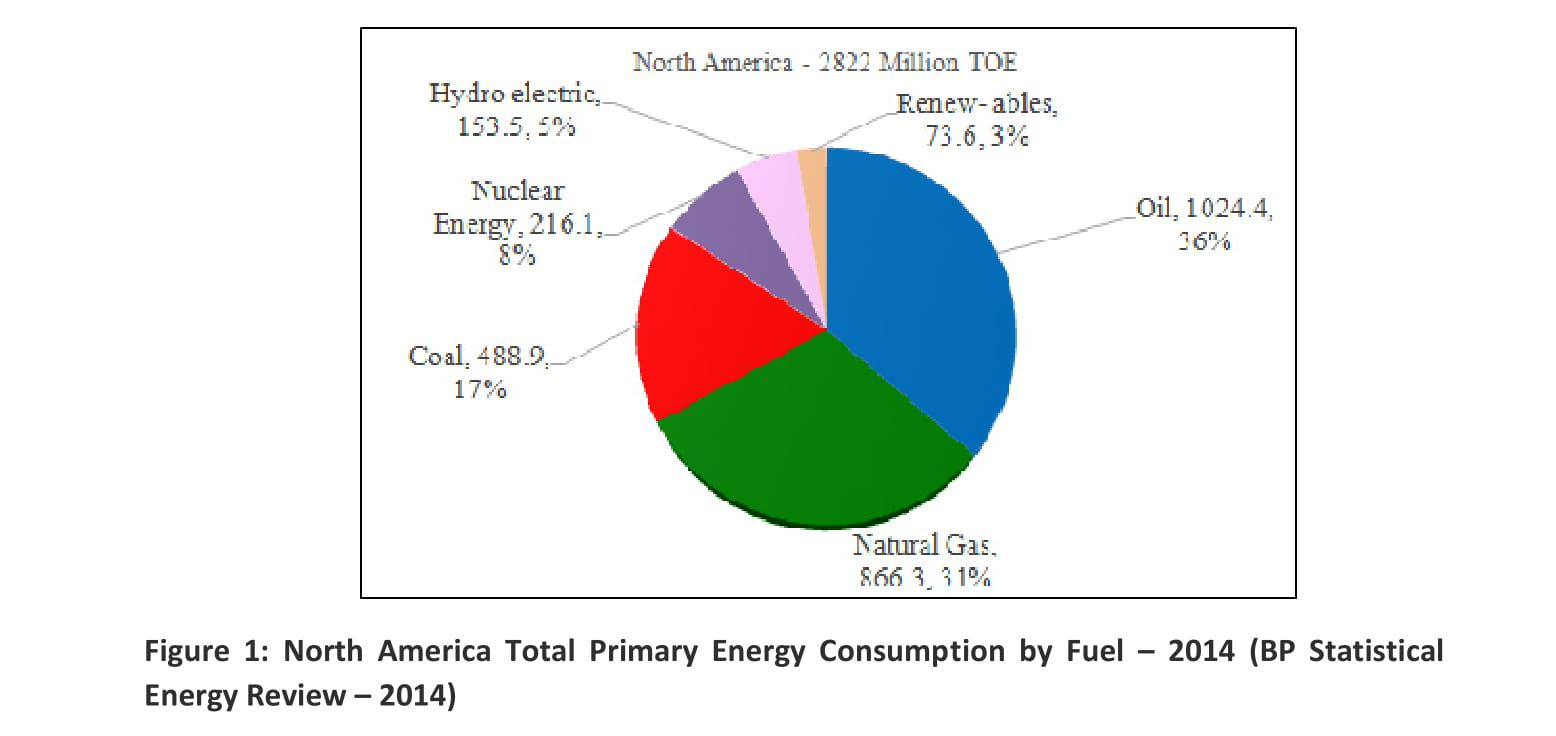
In order to comprehend the market it’s useful to briefly review the current energy situation in North America. Out of global total primary energy consumption (TPEC) of 12928 million tonnes of oil equivalent (MTOE) in 2014, North America accounted for 2822 MTOE or 21.83%. The share of the USA was about 18%. Oil and gas dominate with 67% (oil 36.3%, natural gas 30.7%), coal 17.3%, nuclear 7.65%, hydro electric 5.4% and renewables 2.6% (Figure -1). Despite consuming oil and natural gas fuels in bulk, its indigenous resource base is quite thin. For example, it holds 232 billion barrels of oil reserves, a global share of 13.7% and a life expectancy of 34 years. Natural gas reserves are at 429 TCF, 6.5% of the global reserves with a life expectancy of 12.8 years [1]. Coal stands at 245 billion tonnes with a global share of 27.5% and a life expectancy of 248 years.
North America: Resources
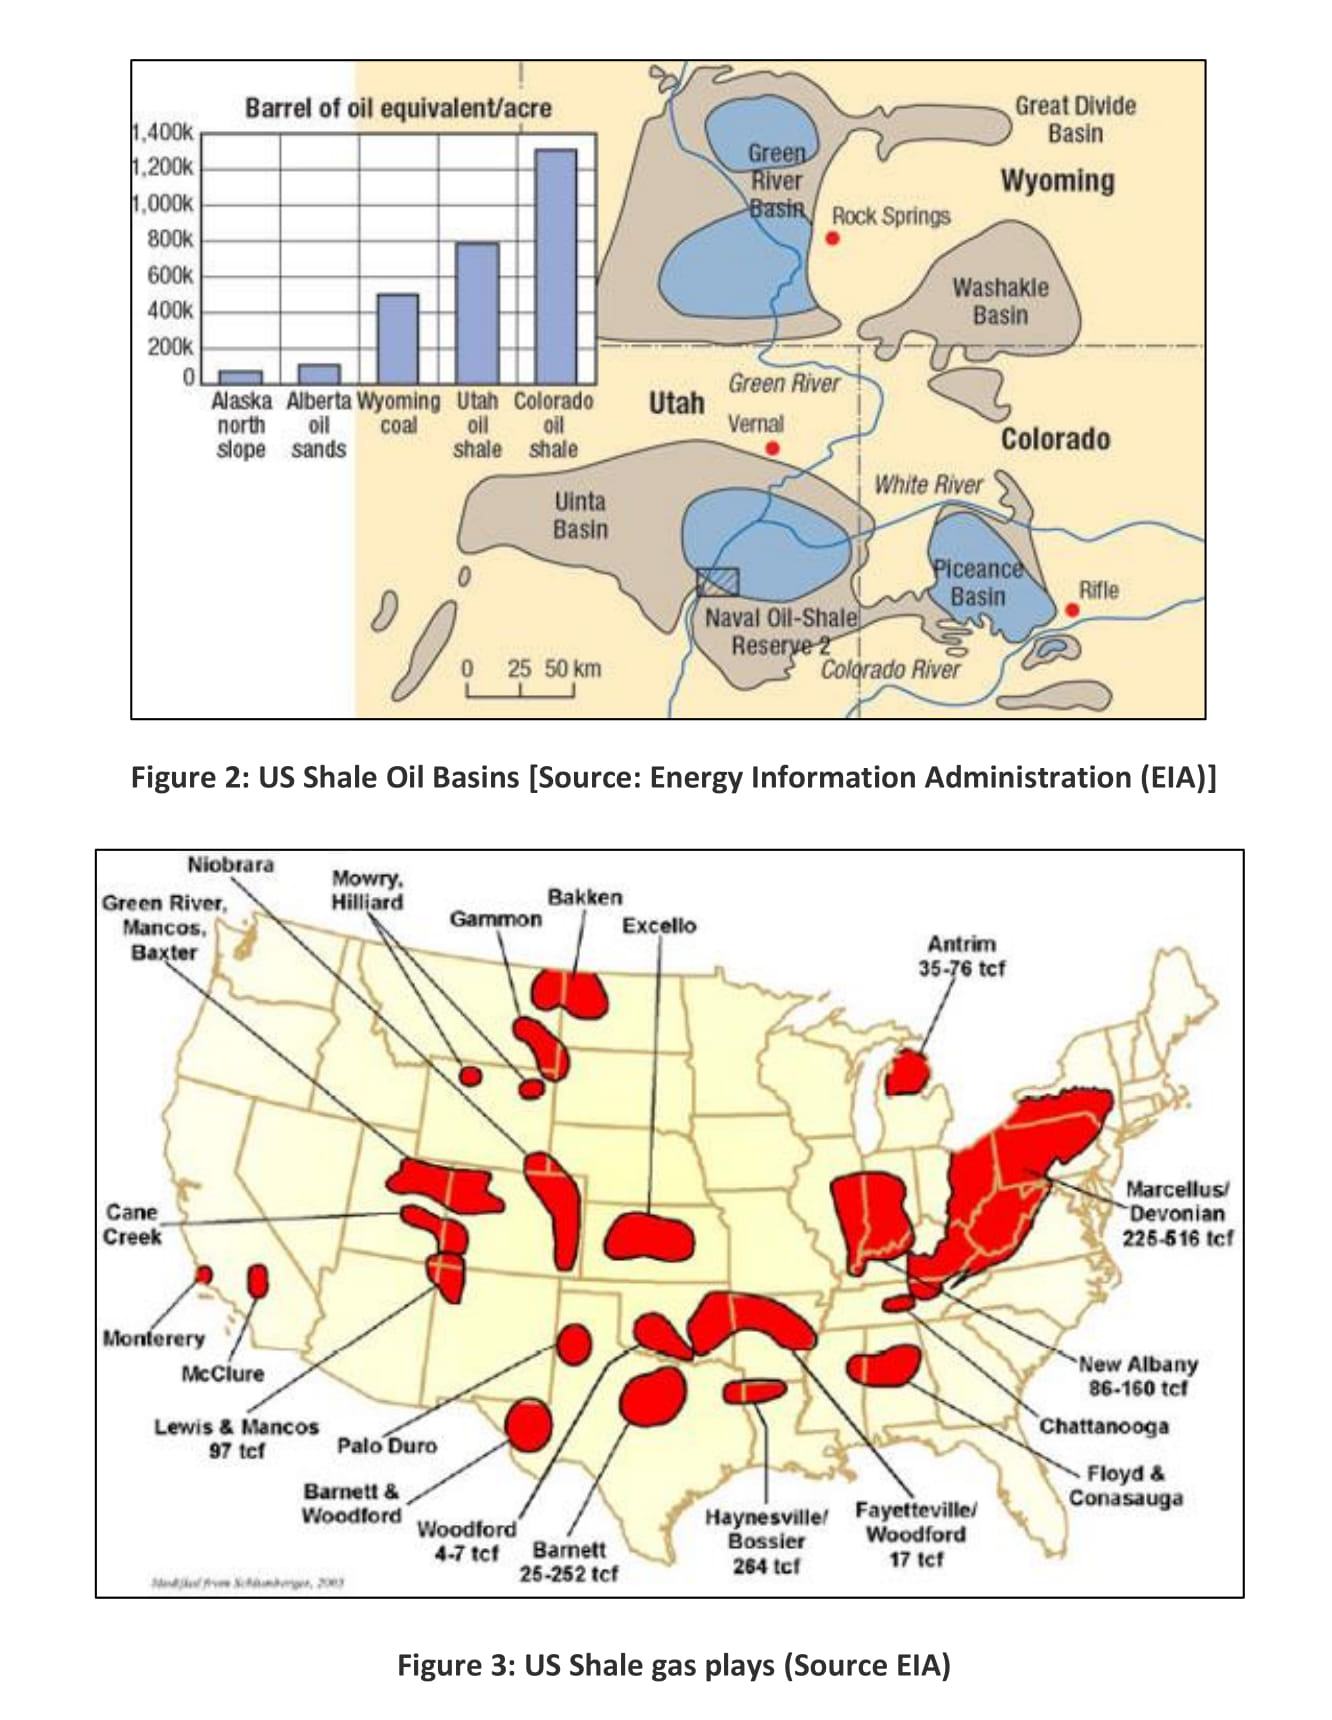
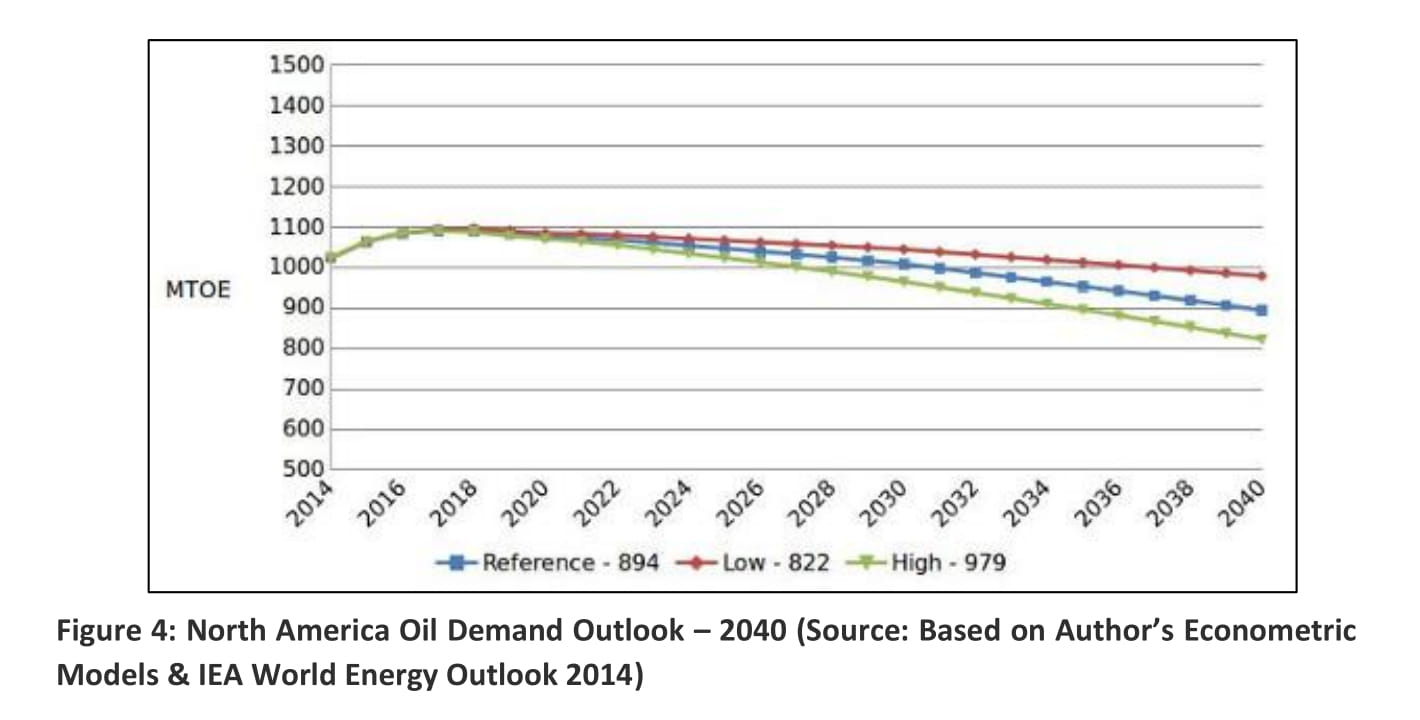
North America also holds enormous unconventional shale oil and shale gas resources (Figures 2 & 3). Technological advancement in horizontal drilling and hydraulic fracturing allowed the US to significantly increase shale oil and shale gas production. As a result, US net oil import dependency declined from 60% in 2007 to about 27% in 2014. Shale gas and renewable fuel (ethanol) is expected to continue to penetrate the transport sector and industrial uses which would help North America to reduce its crude oil consumption in favor of natural gas and renewable fuels.
North America: Energy Demand Outlook – 2040
North American energy demand is mainly driven by respective energy prices, GDP and trend variables. Trend variables have been used to capture technological advancements. The population though is an important driver of energy demand and should be positively correlated, however for North America it failed to explain energy behaviour and when included distorted the other important explanatory variables like GDP and is therefore dropped. A number of models have been tested including static, Koyack and polynomial distributed lag (Almon) model with varying degree of weights and lags to capture the lag structure. The best estimated models for each of the energy sources are selected and later re-run to forecast respective energy demand to 2040 under alternative scenarios.
Oil Demand Outlook – 2040
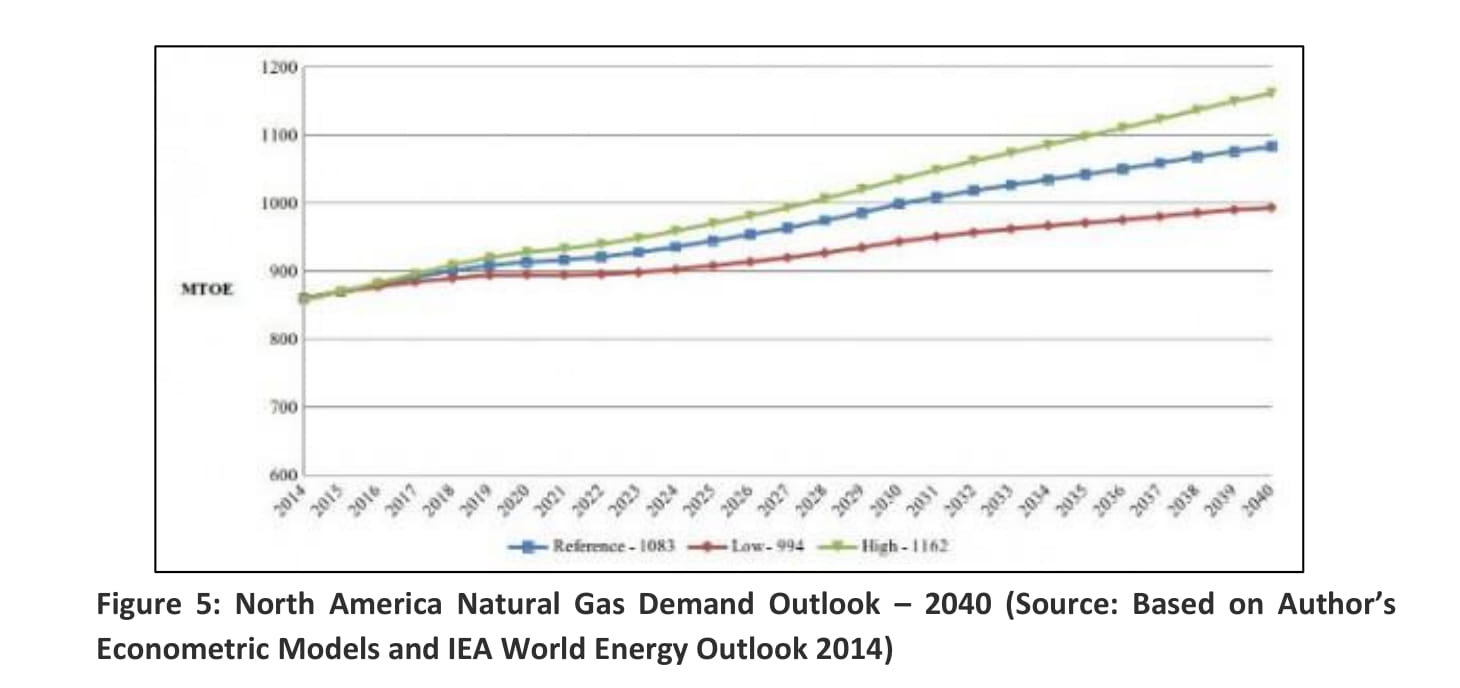
North American oil demand is projected to decline over time due to penetration of NGVs, electric and fuel cell cars in the transport sector as well as efficiency gains. At the end of 2040, under the reference case North America is expected to consume 894 MTOE (20.41 MMBD) [2] as compared to 1024 MTOE (23.34 MMBD) in 2014 see Figure 4. The reference case is bounded by low and high case of 822 (18.76 MMBD) and 979 MTOE (22.34 MMBD). The way the technology is developing transport sector, electric and fuel cells cars in particular, it is quite possible that the share of oil in the North American energy mix will decline from the current 36% to 20% at the end of 2040.
Natural Gas Demand Outlook – 2040
Unlike oil, natural gas demand is projected to increase in North America. The reason being the region’s enormous unconventional gas resources and the expected continuance of the shale gas boom. Both the USA and Canada have aggressive plans to export natural gas in the form of LNG to the global market. In addition, consumption of natural gas in power generation increased, particularly in the USA. Natural gas share in power generation went up from 17% in 2001 to 27.4% again due to significant increase in US shale gas production. North American natural gas demand under the reference case is projected to increase from 866 MTOE in 2014 (949 BCM) in 2014 to 1083 MTOE (1192 BCM) at the end of 2040, see Figure 5. The reference case is bounded by low and high case of 994 (1093 BCM) and 1162 MTOE (1278 BCM) in 2040. We anticipate a greater role for natural gas because it will capture a share in power generation from coal and because of its growing importance in the transport sector.
Coal Demand Outlook – 2040
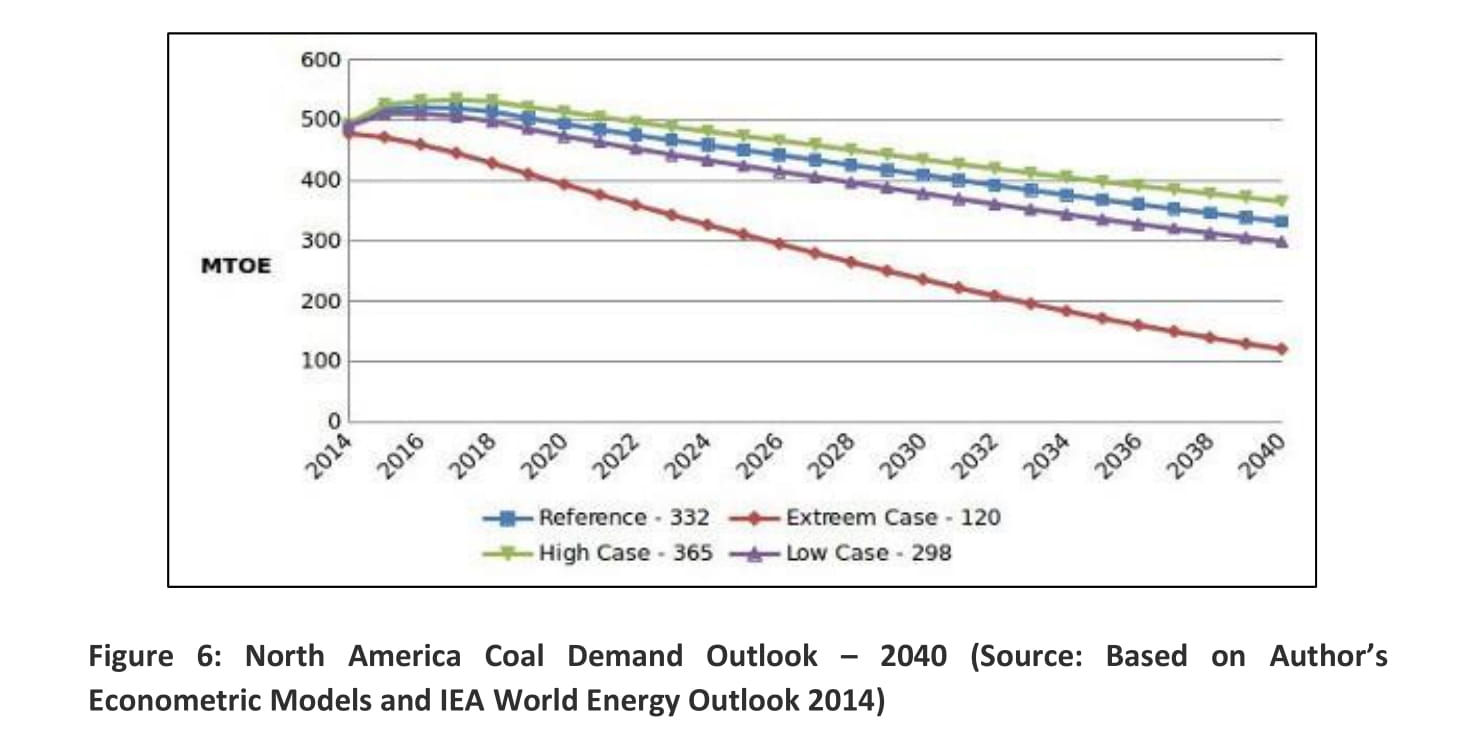
The contribution of coal is mostly associated with power generation. However, the recent shale gas boom has reduced its role particularly in power generation. The contribution of coal in US power generation for instance went down from 51% in 2001 to about 39% in 2014. While the share of natural gas in power generation went up from 17% in 2001 to 27.4% again due to significant increase in US shale gas production. During 1980 to 2014, coal consumption increased from 413 MTOE in 1980 to 489 MTOE in 2014. However, due to strict environmental regulations and availability of natural gas and renewable sources its role is expected to shrink during next 2.5 decades. The model predicts that coal consumption is projected to decline from 489 MTOE in 2014 to 332 MTOE in 2040 under the reference case (Figure 6). The reference case is bounded by a low (298 MTOE) and a high of (365 MTOE) in 2040. We have added another scenario which assumes very rigid environmental regulations are imposed and technological advancement allow for the speedy penetration of renewable sources. In this case we have used trend variable (T2). In this scenario coal demand is projected to decline significantly to 120 MTOE.
Nuclear Demand Outlook – 2040
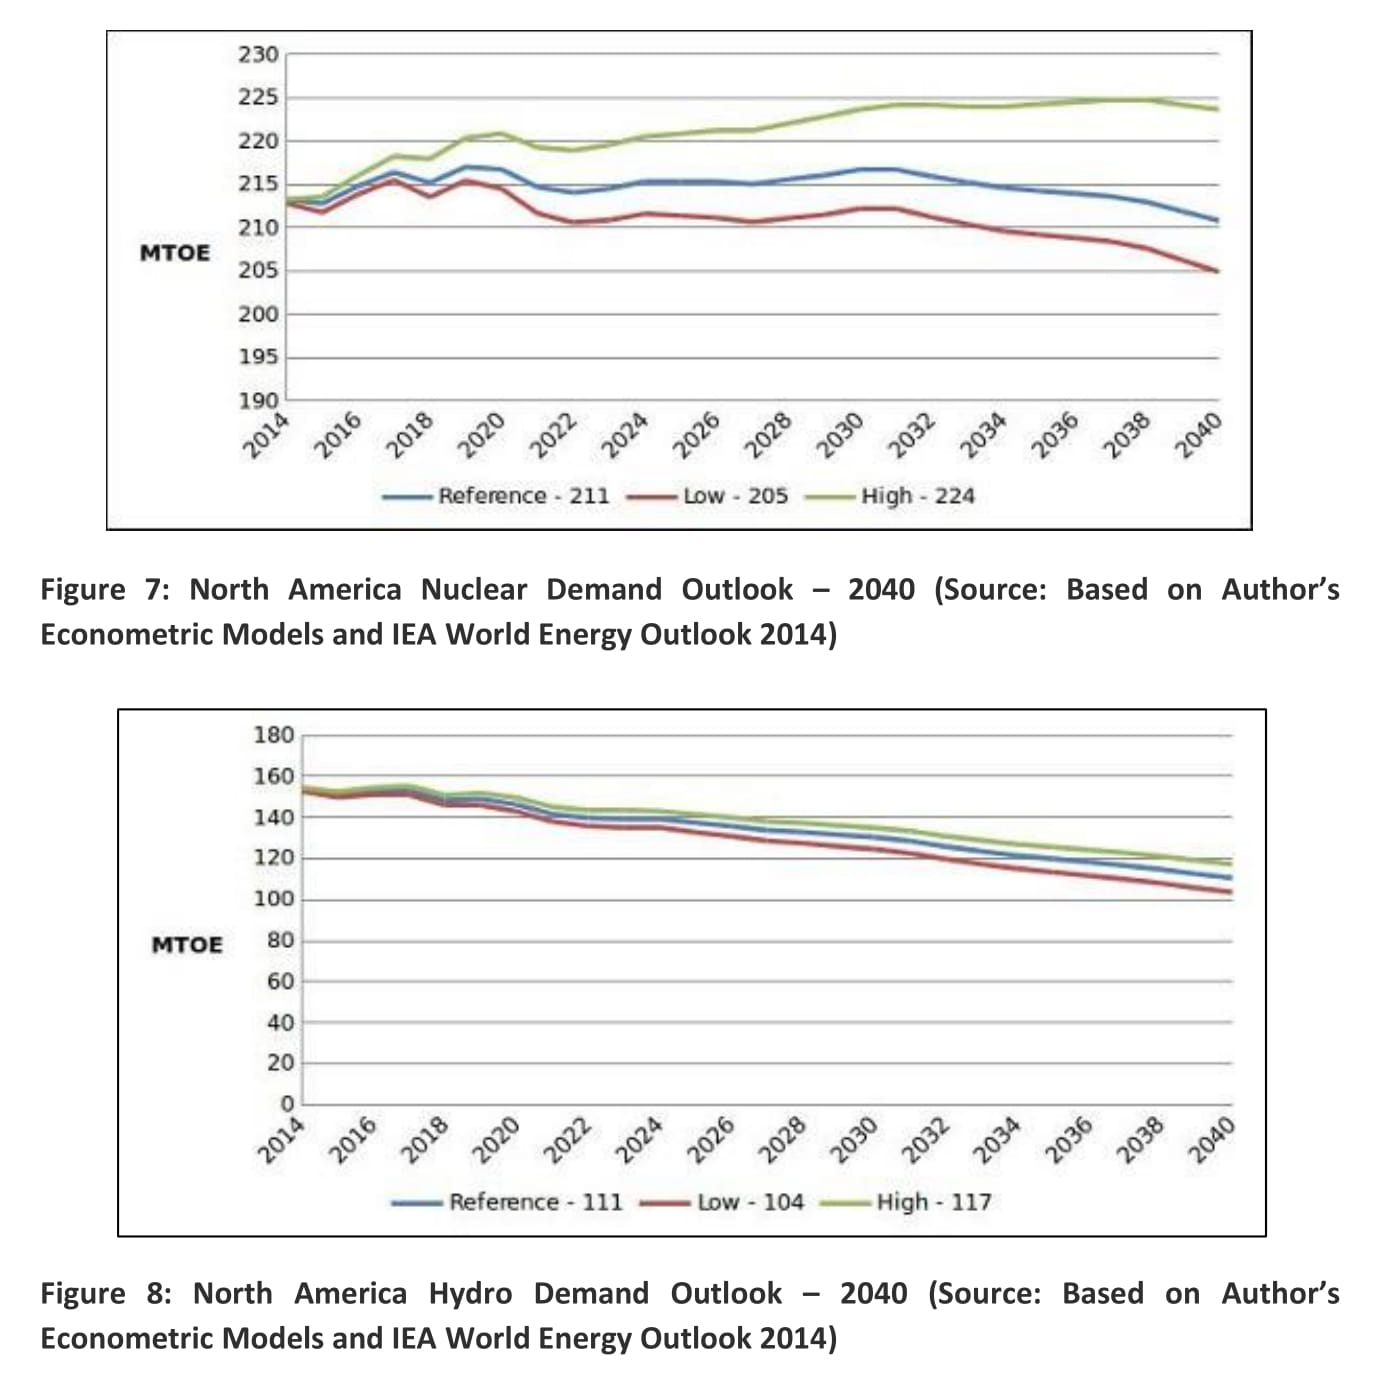
Electricity demand is dependent on various factors such as GDP, prices and weather. However it is positively correlated with the economic growth measured by GDP. During 1980 to 2014, the demand for nuclear energy increased from 68 MTOE in 1980 to 216 MTOE in 2014 – an increase of 217% (Figure 7). More than 94% of the variation in nuclear demand is explained by GDP and electricity prices. GDP remains the main driver of electricity demand as one percent increase in GDP will lead to 0.68 percent increase in nuclear demand. Under the reference case nuclear demand is projected to decline from 216 MTOE in 2014 to 211 MTOE in 2040 due to efficiency losses and closure of some of old nuclear plants. Reference case is bounded by low of 205 MTOE and high of 224 MTOE in 2040.
Hydro Electricity Demand Outlook – 2040
Canada is the major producer and consumer of hydro electricity in North America accounting for 56% of the regional hydro electricity in 2014. Hydro electricity consumption increased from 118 MTOE in 1980 to 154 MTOE in 2014 – an increase of 30%. Surprisingly, based on the model, hydro electricity demand is projected to decline during the 2014/2040 in period. This is probably due to a decreasing availability of hydro. It is also possible the model failed to explain the correct behaviour. Under the reference case it is projected to decline from 154 MTOE in 2014 to 111 MTOE in 2040, in the low case it further declines to 104 MTOE and for high economic growth it declines to 117 MTOE (Figure 8). The demand for hydro should be increasing unless it is constrained by its availability or massive increase in renewables – solar, fusion and wind.
Renewable Demand Outlook – 2040
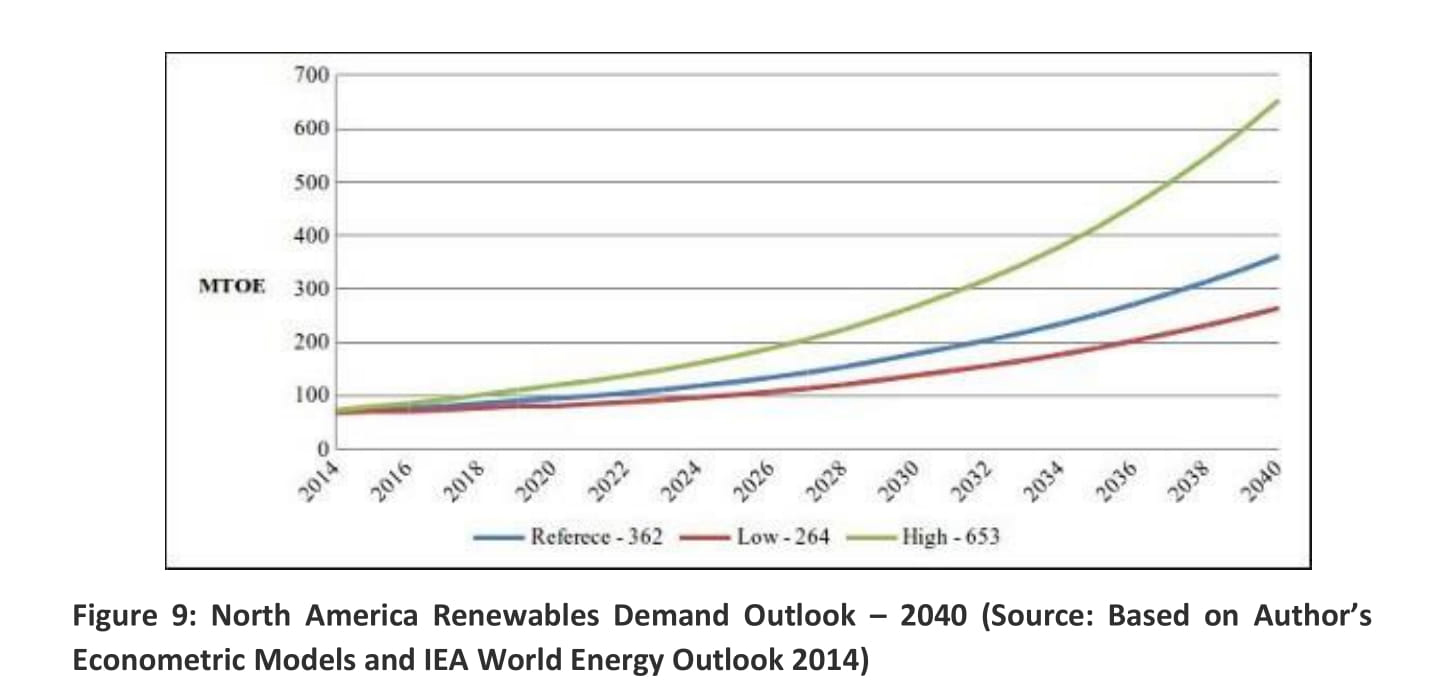
The contribution of renewables in the North American energy mix in 1980 was barely anything, however, its contribution increased quite rapidly during the last decade. Despite its significant growth, the contribution of renewables remained thin and stood at less than 3% at the end of 2014. The contribution of renewables is expected to grow rapidly during 2014 to 2040 due to: expected significant decline in cost of wind, solar and other renewables as a result of technological advancements; utility scale solar power generation capacity delivering a price below that of coal/natural gas power plants; extensive use of solar panels in powering the residential and office buildings; increase in the usage of ethanol in the transport sector and a changing mind set of future generations favoring green. However, it is difficult to quantify these variables in our econometric models. We have to continue to rely on GDP and electricity prices to model consumer’s behaviour, though various other factors are important to explain the demand for renewable sources of energy. We have assumed that the trend variable is expected to capture the increasing availability of renewable sources at competitive prices and we assume the trend variable to grow exponentially during the forecasting period due to rapid technological advancements. The other important variables are GDP and electricity prices. Based on our assumptions and model the demand for renewable sources of energy under reference case is projected to increase from 74 MTOE in 2014 to 362 MTOE in 2040 – an increase of over 389%. The reference case is bounded by a low of 264 MTOE and a 653 MTOE high (Figure 9).
North America TPEC Outlook – 2040 (MTOE)
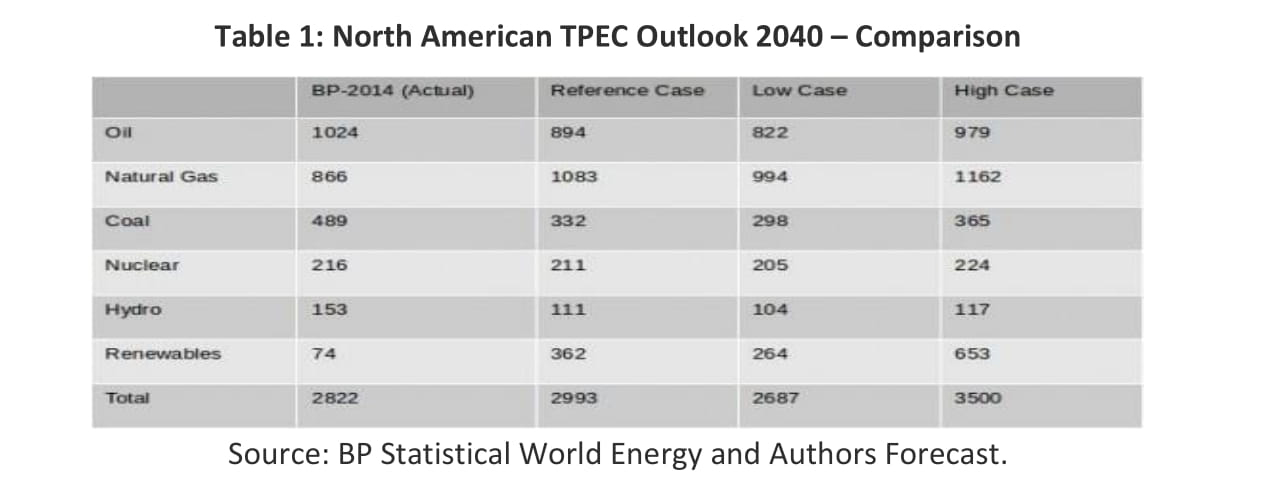
Table 1 provides a quick summary and comparison of North American TPEC outlook 2040 by energy sources. The authors’ forecast is based on regional GDP growth, respective energy prices and trend variables. What message can we draw from this analysis? The news and academic papers report about the important role of renewable sources in the TPEC mix. However, based on the forecast, the message is quite clear that the role of fossil fuels most likely will remain the dominant sources of energies in North America despite significant growth in renewable sources. Based on authors forecast the share of fossil fuels remains between 71% and 78%. It is quite possible that the share of fossil fuels particularly that of oil may decline from current 36% to 20% by 2040. This lost share will be captured by renewable. Therefore, it is quite possible that the contribution of renewables may further increase, nearing our high case scenario. Especially considering various car companies are in the process of bringing fuel cell and electric cars to market. In fact, Toyota already started selling the world’s first mass market fuel cell car in Japan in 2014 – the four-door Mirai [3] . The auto giant is hoping to build on the success of its popular gasoline-electric hybrid Prius to sell tens of thousands of the eco-friendly Mirai over the next decade, as it looks to stop producing fossil fuel based cars altogether by 2050. Honda’s rival Clarity fuel cell vehicle features a cruising range of more than 700 kilometers (430 miles), which it claims is the furthest range on the market, and can store enough power to supply an average household’s energy needs for a week. As far as solar energy is concerned its cost has reduced significantly. According to Lawrence Berkeley National Laboratory, who conducted the report, installed project costs have fallen by more than 50% since 2009, from about $6.3/W in 2009 to $3.1/W for projects completed in 2014.
We believe that the contribution of renewables most likely will remain between 9% and 12% for low and reference case scenarios, however in the extreme high its contribution may increase to about 19% based on model predictions. In our opinion the high contribution of renewables in the energy mix is highly dependent on timing and availability of fusion electricity which is still in its research stages, and efforts are being made to produce electricity on commercial scales. If fusion electricity is available during the projection period then it is quite possible that the role of renewables will increase to 19% or even more otherwise its contribution will most likely remain under 12%.
Good news for oil and gas industry
Our long-term North American energy demand forecast highlights that the contribution of fossil fuels under alternative scenarios, particularly that of oil and gas are likely to remain the major driver of the North American economy. However, oil and gas companies should also prepare and develop alternative strategies in case rapid penetration of renewable in transport and power generation takes place earlier than 2030.
Footnotes
- Conventional oil and gas resources.
- We have used BP Statistical Energy Review historical data. The conversion factors vary from region to region. Normally a conversion factor of 7.33 is used. To get an average conversion factor we have used 1980 to 2014 oil consumption barrels per day multiplied by 365 and divided by respective year MTOE. The average conversion factor of 8.32 is used.
- Gulf Times Oct 29, 2015.
Dr. Salman Ghouri is an Oil & Gas Advisor (Geopolitics | Economics | Development) Dr. Yumna Ghouri is in the medical profession with a strong background in research, statistics and editing.
Note: This paper was published in European energy Review on November 27, 2015. Please visit the following link: http://www.europeanenergyreview.eu/rise-renewables-threat-oil-gas-industry/
All rights reserved. No part of this publication may be reproduced in any form without written consent from the publisher. For inquiries please contact europeanenergyreview@eimworld.com.